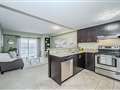
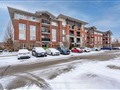
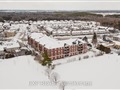
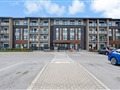
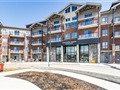
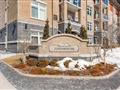
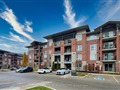
60 Lynnmore St 414
$518,713
Comparative Market Analysis
Jun 1, 2025
NOT AN ACTIVE LISTING
Historical Performance
| Period | $ Change | % Change |
| 1 Day | +$611 | +0.118% |
| 7 Days | +$173 | +0.033% |
| 30 Days | +$2,011 | +0.389% |
| 3 Months | +$661 | +0.128% |
| 6 Months | +$4,577 | +0.890% |
| 1 Year | -$26.0k | -4.77% |
| 3 Years | +$76.4k | +17.3% |
| 5 Years | +$134k | +34.9% |
| 10 Years | +$288k | +125% |
List My Property
Real Estate Statistics
Financing Solutions
AS SEEN ON


Are You a Licensed Real Estate Agent or Broker?