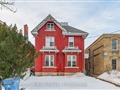
31 Kent St
$721,534
Comparative Market Analysis
Jul 4, 2025
NOT AN ACTIVE LISTING
Historical Performance
| Period | $ Change | % Change |
| 1 Day | +$48 | +0.007% |
| 7 Days | -$444 | -0.061% |
| 30 Days | -$2,580 | -0.356% |
| 3 Months | -$3,758 | -0.518% |
| 6 Months | +$10.8k | +1.52% |
| 1 Year | -$38.8k | -5.10% |
| 3 Years | +$124k | +20.8% |
| 5 Years | +$210k | +41.1% |
| 10 Years | +$399k | +124% |
List My Property
Real Estate Statistics
Financing Solutions
Browsing History
62 Walker Way, Guelph
2 seconds ago
52 Walker Way, Guelph
2 seconds ago
AS SEEN ON


Are You a Licensed Real Estate Agent or Broker?